How synthetic sales data became a working AI-assisted business prototype
In the first article in this series, Sometimes the Best Place to Begin Is a CSV File, we explored a simple premise:
A trusted data export may be enough to begin testing an idea before committing to a complex integration project.
We have now put that premise into practice.
Five CSV files containing entirely synthetic sales information became the foundation for an interactive, browser-based sales dashboard.
The result is not intended to replace an ERP system, accounting application, or established business-intelligence platform. It demonstrates how information a business may already be able to export can become the starting point for a focused AI-assisted prototype.
Five CSV files became the source
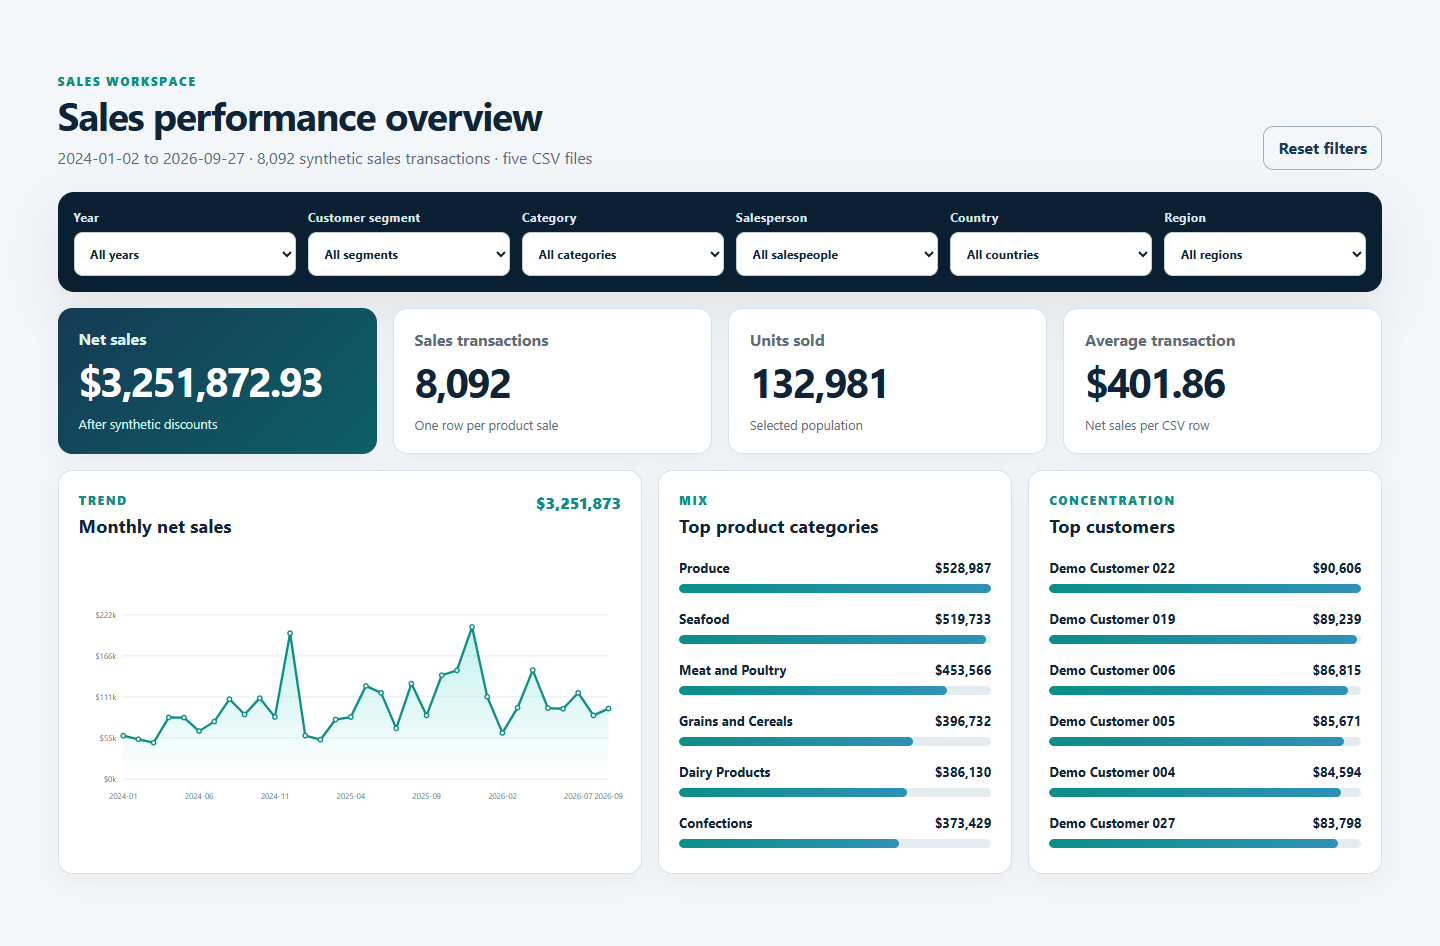
The demonstration uses one consolidated transaction file and four supporting files:
| File | Records | Purpose |
|---|---|---|
| sales_transactions.csv | 8,092 | Individual sales transactions |
| customers.csv | 80 | Customer names, segments, and locations |
| salespeople.csv | 6 | Salesperson names and roles |
| products.csv | 48 | Product names, codes, prices, and categories |
| product_categories.csv | 8 | Product-category names and descriptions |
The transaction file records what happened: the date, customer, salesperson, product, quantity, selling price, discount, and net sales amount.
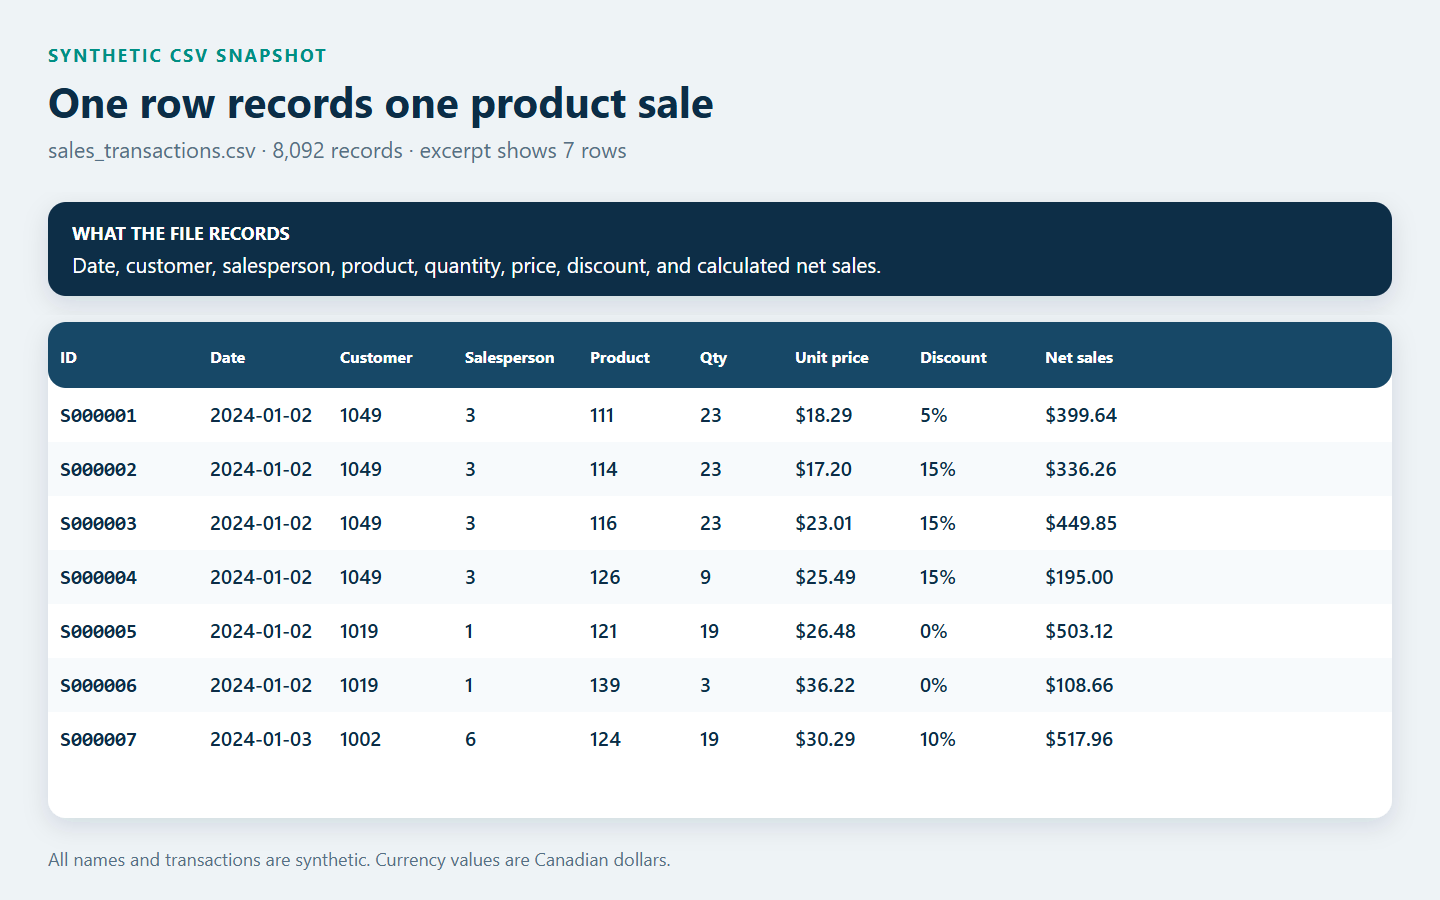
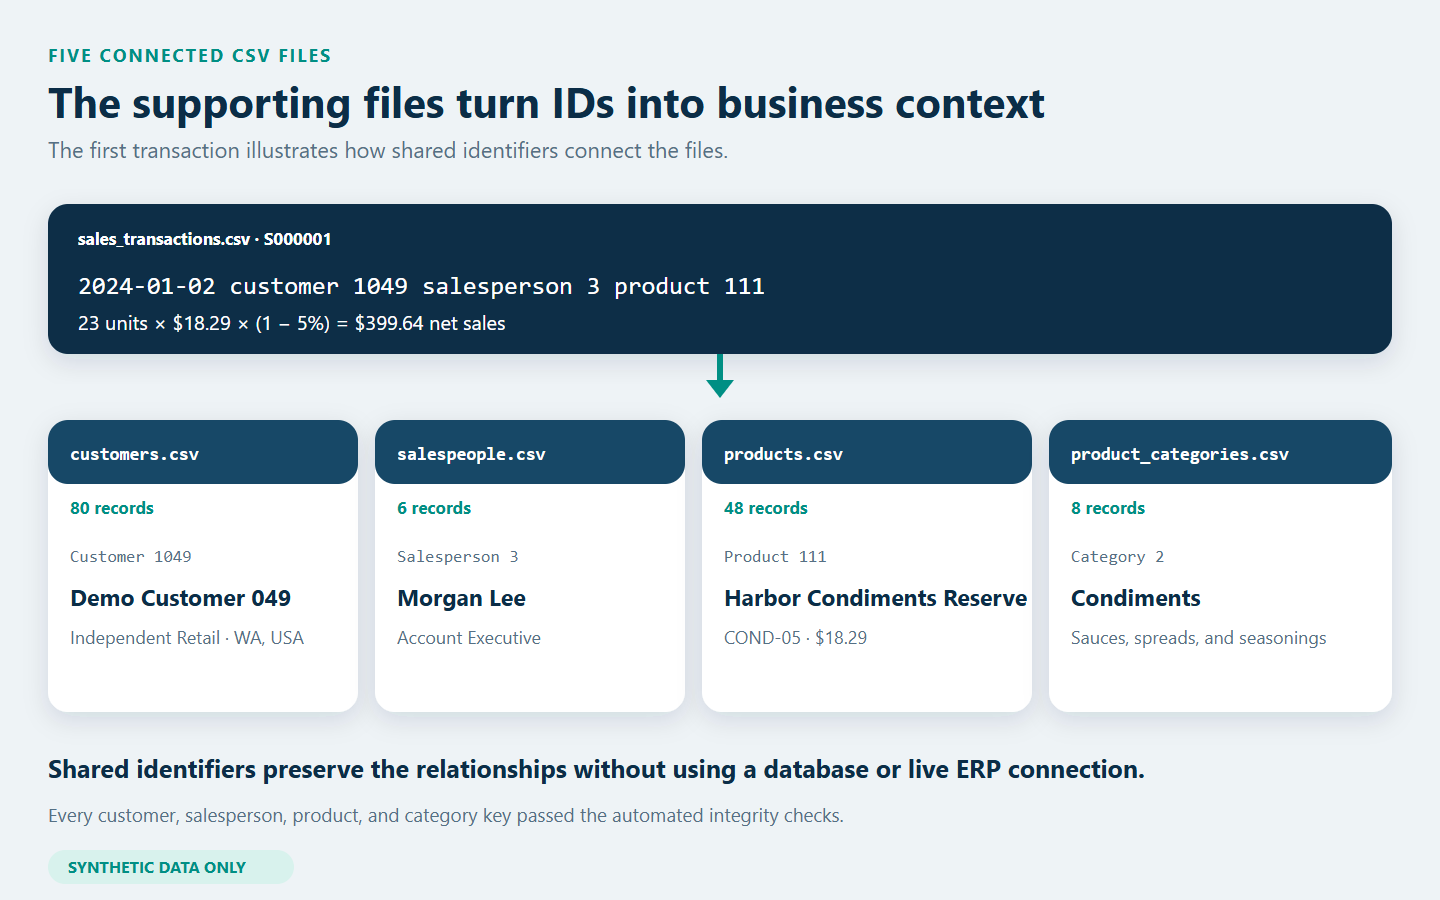
The supporting files supply the business context. They allow a product identifier to become a recognizable product name, a customer identifier to become a company and region, and a salesperson identifier to become a person.
In database terms, the files are related through shared identifiers. From a business user's perspective, the simpler explanation is that the sales file records the activity while the other files help explain and classify it.
The data is entirely synthetic
The fictional company in this demonstration is ASI Synthetics Corp.
No genuine customer, employee, product, or transaction information was used. The data was created to resemble the structure and patterns of a sales dataset without reproducing confidential business records.
The dataset covers January 2, 2024 through September 27, 2026 and contains:
- 8,092 sales transactions
- CAD 3,251,872.93 in net sales
- 132,981 units sold
- An average transaction value of CAD 401.86
Synthetic data allows us to explore the idea, refine the interface, and test calculations before deciding whether a real business dataset should ever be introduced.
It is more than a privacy precaution. It also creates room to experiment. We can add unusual sales patterns, missing classifications, seasonal changes, or other scenarios without changing or damaging production information.
View the filtered dashboard
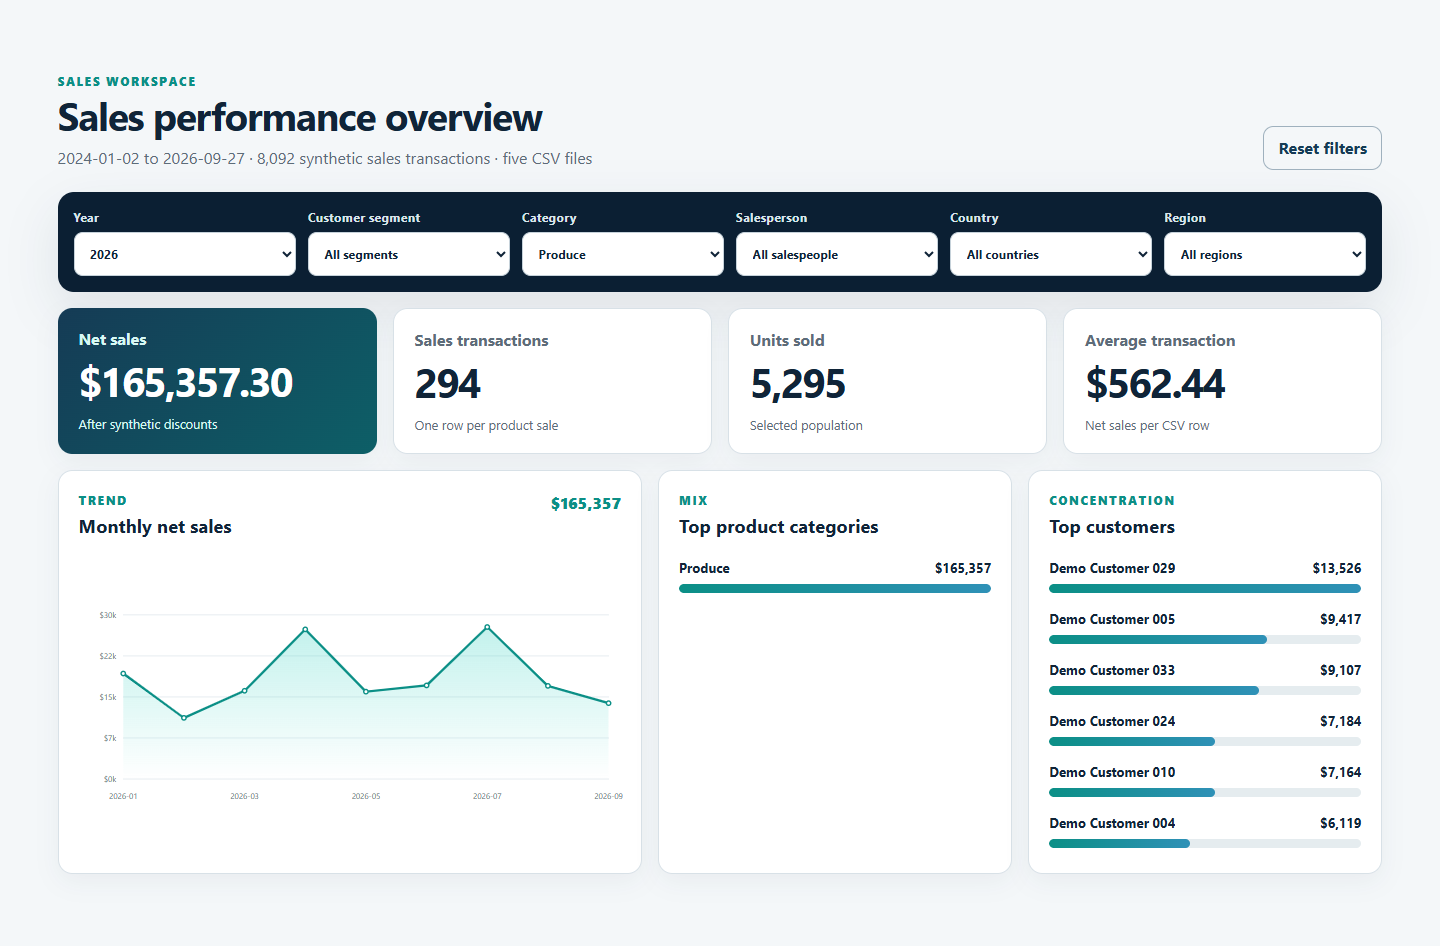
The dashboard turns the five source files into several ways of exploring the business:
- Net sales
- Number of sales transactions
- Units sold
- Average transaction value
- Monthly sales trends
- Top product categories
- Top customers
- Searchable transaction detail
Users can filter the results by year, customer segment, product category, salesperson, country, and region.
Those filters are important because a dashboard becomes more useful when users can move beyond a company-wide total and ask narrower questions:
- What happened in a particular year?
- Which categories are strongest in a specific region?
- How much business came from one customer segment?
- Which customers or products contributed most to the selected result?
Explore the live dashboard
Filter the synthetic sales and inspect the results in a full-screen workspace.
Explore the live dashboardDownload the source CSV files
Five synthetic CSV files and README. Version October 3, 2026 · ZIP, 107 KB.
Download the source CSV filesMove from summary to detail
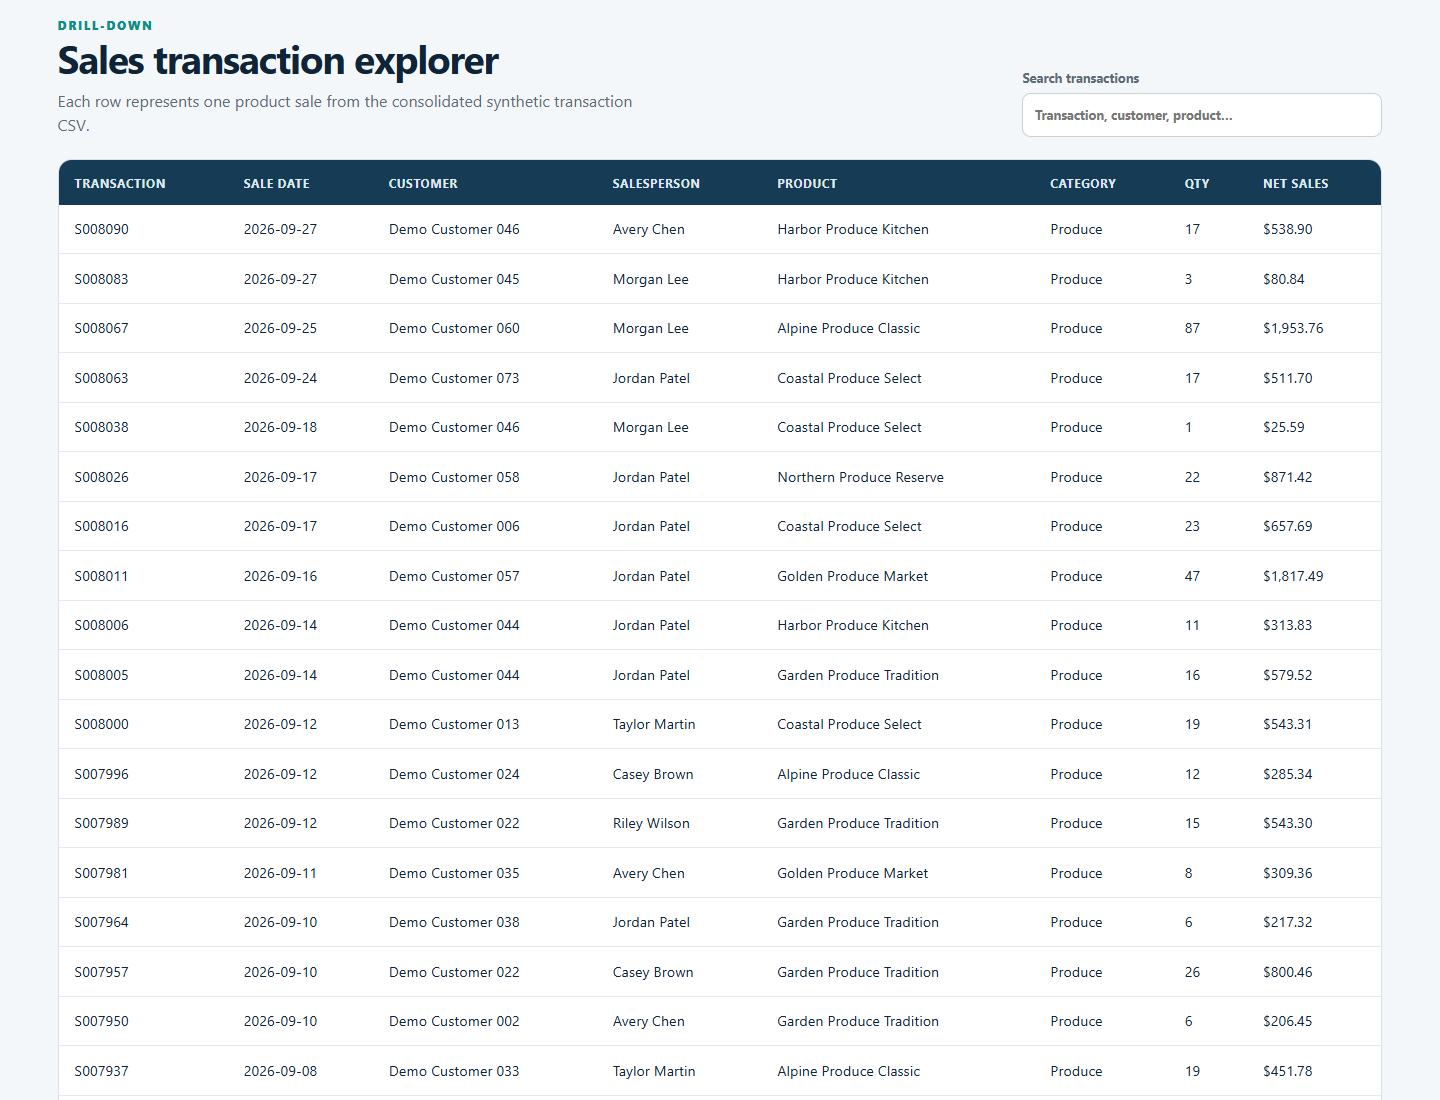
Charts are useful for identifying patterns, but business users often want to examine the transactions behind a result.
The dashboard therefore includes a searchable transaction explorer. A user can filter the dashboard, review the summarized results, and then inspect the supporting sales records.
This creates a useful bridge between two common needs:
- A quick visual overview for understanding performance
- Detailed records for investigating what contributed to that performance
Validation matters as much as presentation
A polished dashboard is not useful if its totals cannot be trusted.
The demonstration therefore includes automated checks covering the source files, their shared identifiers, the sales calculation, and the dashboard totals.
Net sales for each transaction is calculated as:
Quantity × Unit Price × (1 − Discount Rate)
The result is rounded to the nearest cent.
The completed package passed 19 of 19 automated integrity checks. These checks confirmed, among other things, that:
- Transaction identifiers are unique
- Every customer, salesperson, product, and category identifier resolves to a supporting record
- Transaction-level net sales calculations reconcile within one cent
- Dashboard transaction counts, units, and sales totals match the CSV source data
- The package contains no order, invoice, shipment, or payment fields
- The demonstration does not depend on SQLite or a live database connection
- The dashboard's local application files load successfully
| Validation control | Result |
|---|---|
| Sales transactions | 8,092 |
| Net sales | CAD 3,251,872.93 |
| Units sold | 132,981 |
| Automated checks | 19 of 19 passed |
These controls do not prove that a future production solution will be accurate. They demonstrate the discipline required to compare an AI-assisted result with known source totals.
What this prototype demonstrates
The experiment suggests a practical pathway for exploring existing business information:
- Begin with a report the business already understands and trusts.
- Identify the underlying fields required to support that report.
- Review the structure and business meaning of those fields.
- Create synthetic records with the same general structure.
- Build a focused prototype from the synthetic files.
- Reconcile the prototype against known control totals.
- Ask potential users whether the result would help them make decisions.
- Introduce approved real-data extracts or more sophisticated connections only if the prototype demonstrates value.
This separates two decisions that are often combined too early:
- Would the proposed application be useful?
- How should it eventually connect to production systems?
A synthetic CSV prototype can help answer the first question before the organization invests heavily in the second.
What this prototype does not prove
This dashboard is a demonstration, not a production-ready business system.
A production implementation would require decisions about:
- Data ownership and governance
- Privacy and confidentiality
- User access and security
- Export and refresh procedures
- Retention and deletion
- Business definitions
- Reconciliation and exception handling
- Ongoing support
Those considerations matter. But they do not need to prevent a business from exploring an idea safely and on a limited scale.
Extending what you already have
There is considerable excitement about using AI to create entirely new applications.
There is another opportunity that may be just as valuable: using today's tools to extend the systems, reports, and information a business already has.
A CSV export is not the final architecture. It can be the bridge between an idea and the evidence needed to decide what should happen next.
This demonstration began with five simple files. Those files were enough to create a working dashboard, test its calculations, and make the idea tangible.
What comes next
The finished dashboard may make the process look deceptively simple.
It was not created by entering one magical prompt and accepting the first result.
In the next article, we will go behind the dashboard and examine:
- The project brief and prompt
- The role Codex played in working with local files and building the application
- The iterations required to improve the result
- The validation process
- Where human business knowledge and judgment remained essential
The prompt mattered.
The source data mattered.
The ability to inspect, build, test, and refine the result mattered even more.
And it all began with a CSV file.